- This post walks through two complete, unedited sessions with our research agent — both published as public, read-only replays you can open and scroll (session one, session two).
- Session one: asked for a US strategy targeting 10% volatility with a hard −15% drawdown cap, the agent tested three candidates and picked its design not for best return — it was the only candidate whose backtest stayed inside the drawdown goal (−13.8%, full sample and holdout alike).
- Session two: asked for a fossil-free MSCI World tracker, the agent's first draft was rejected by an independent verifier — sound math, thin evidence — repaired with the fund issuers' own methodology documents, and accepted at 2.53% annualized tracking error.
- Both sessions end in an artifact, not just an answer: a draft strategy an agent can run, monitor, and iterate — created paused, because activation is an explicit human approval step.
- The machinery enforcing all of this — the workflow contract, proof gates, and verifiers — is a formal language, covered in the companion post.
Most demos of AI agents show you the final answer. The revealing part is everything the system had to pass before it was allowed to answer. So this post does something slightly unusual: it walks through two complete sessions with our research agent, unedited, both public as read-only replays. One builds and stress-tests an investment strategy; one constructs a constrained, benchmark-aware portfolio. We'll point at the moments that make these sessions governed rather than merely fluent — the declared plan, the evidence, the rejection, the repair.
Can it build a strategy to a risk budget — and prove it holds under stress?
The first request, verbatim (full session):
"Create an investment strategy focused on the broad US market, including equities and bonds or bond ETFs. Target 10% volatility on average by trading in and out of the components as market conditions change. Ensure that the max drawdown does not exceed 15%. Analyze the overall performance of the strategy. Then focus on stress-testing, for example during Covid. Discuss possible remedies."
This is not a portfolio lookup. The agent has to translate a high-level objective into a concrete strategy, test it against a volatility target and a drawdown cap, and then go looking for the places it breaks. It rehearsed three candidate designs and compared them on out-of-sample, drawdown-aware evidence:
| Candidate | The pitch | Max drawdown | Inside the −15% goal? |
|---|---|---|---|
| Trend + momentum + volatility targeting (selected) | Full sample CAGR 5.2% at 6.9% vol; 2019+ holdout CAGR 3.7% at 7.4% vol | −13.8% | Yes |
| Trend-only defensive rotation | Better holdout Sharpe, slightly better Covid crash behavior | about −19.5% | No |
| Static 60/40 fallback | Stronger return and Sharpe, closer to the 10% vol target | about −21.0% | No |
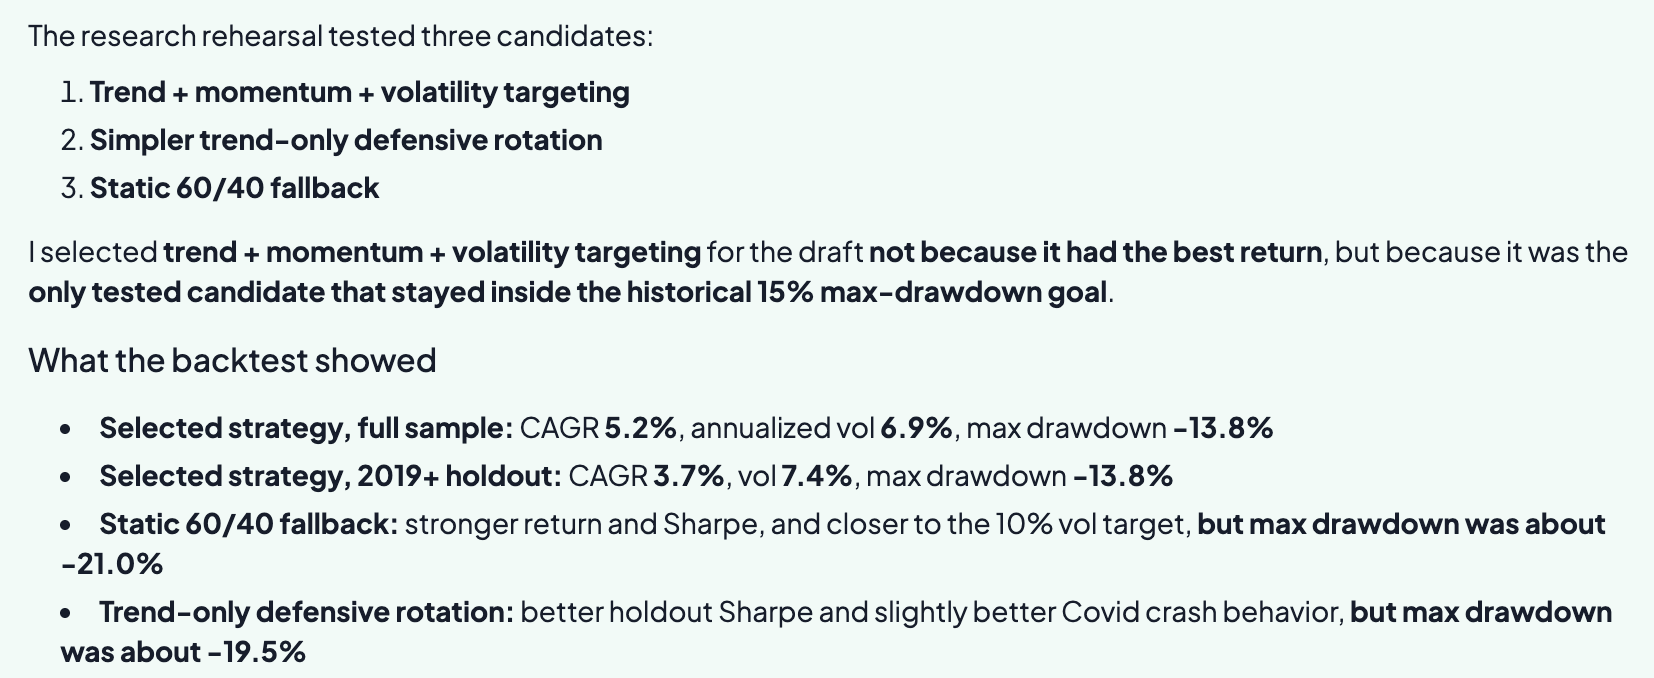
Notice what the agent didn't do: it didn't hand back the 60/40, which had the stronger headline return and Sharpe. The mandate said the drawdown cap was binding, so the comparison was scored on the mandate — return is what you optimize after the constraints hold, not instead of them. Then it went hunting for the failure mode it was asked about:
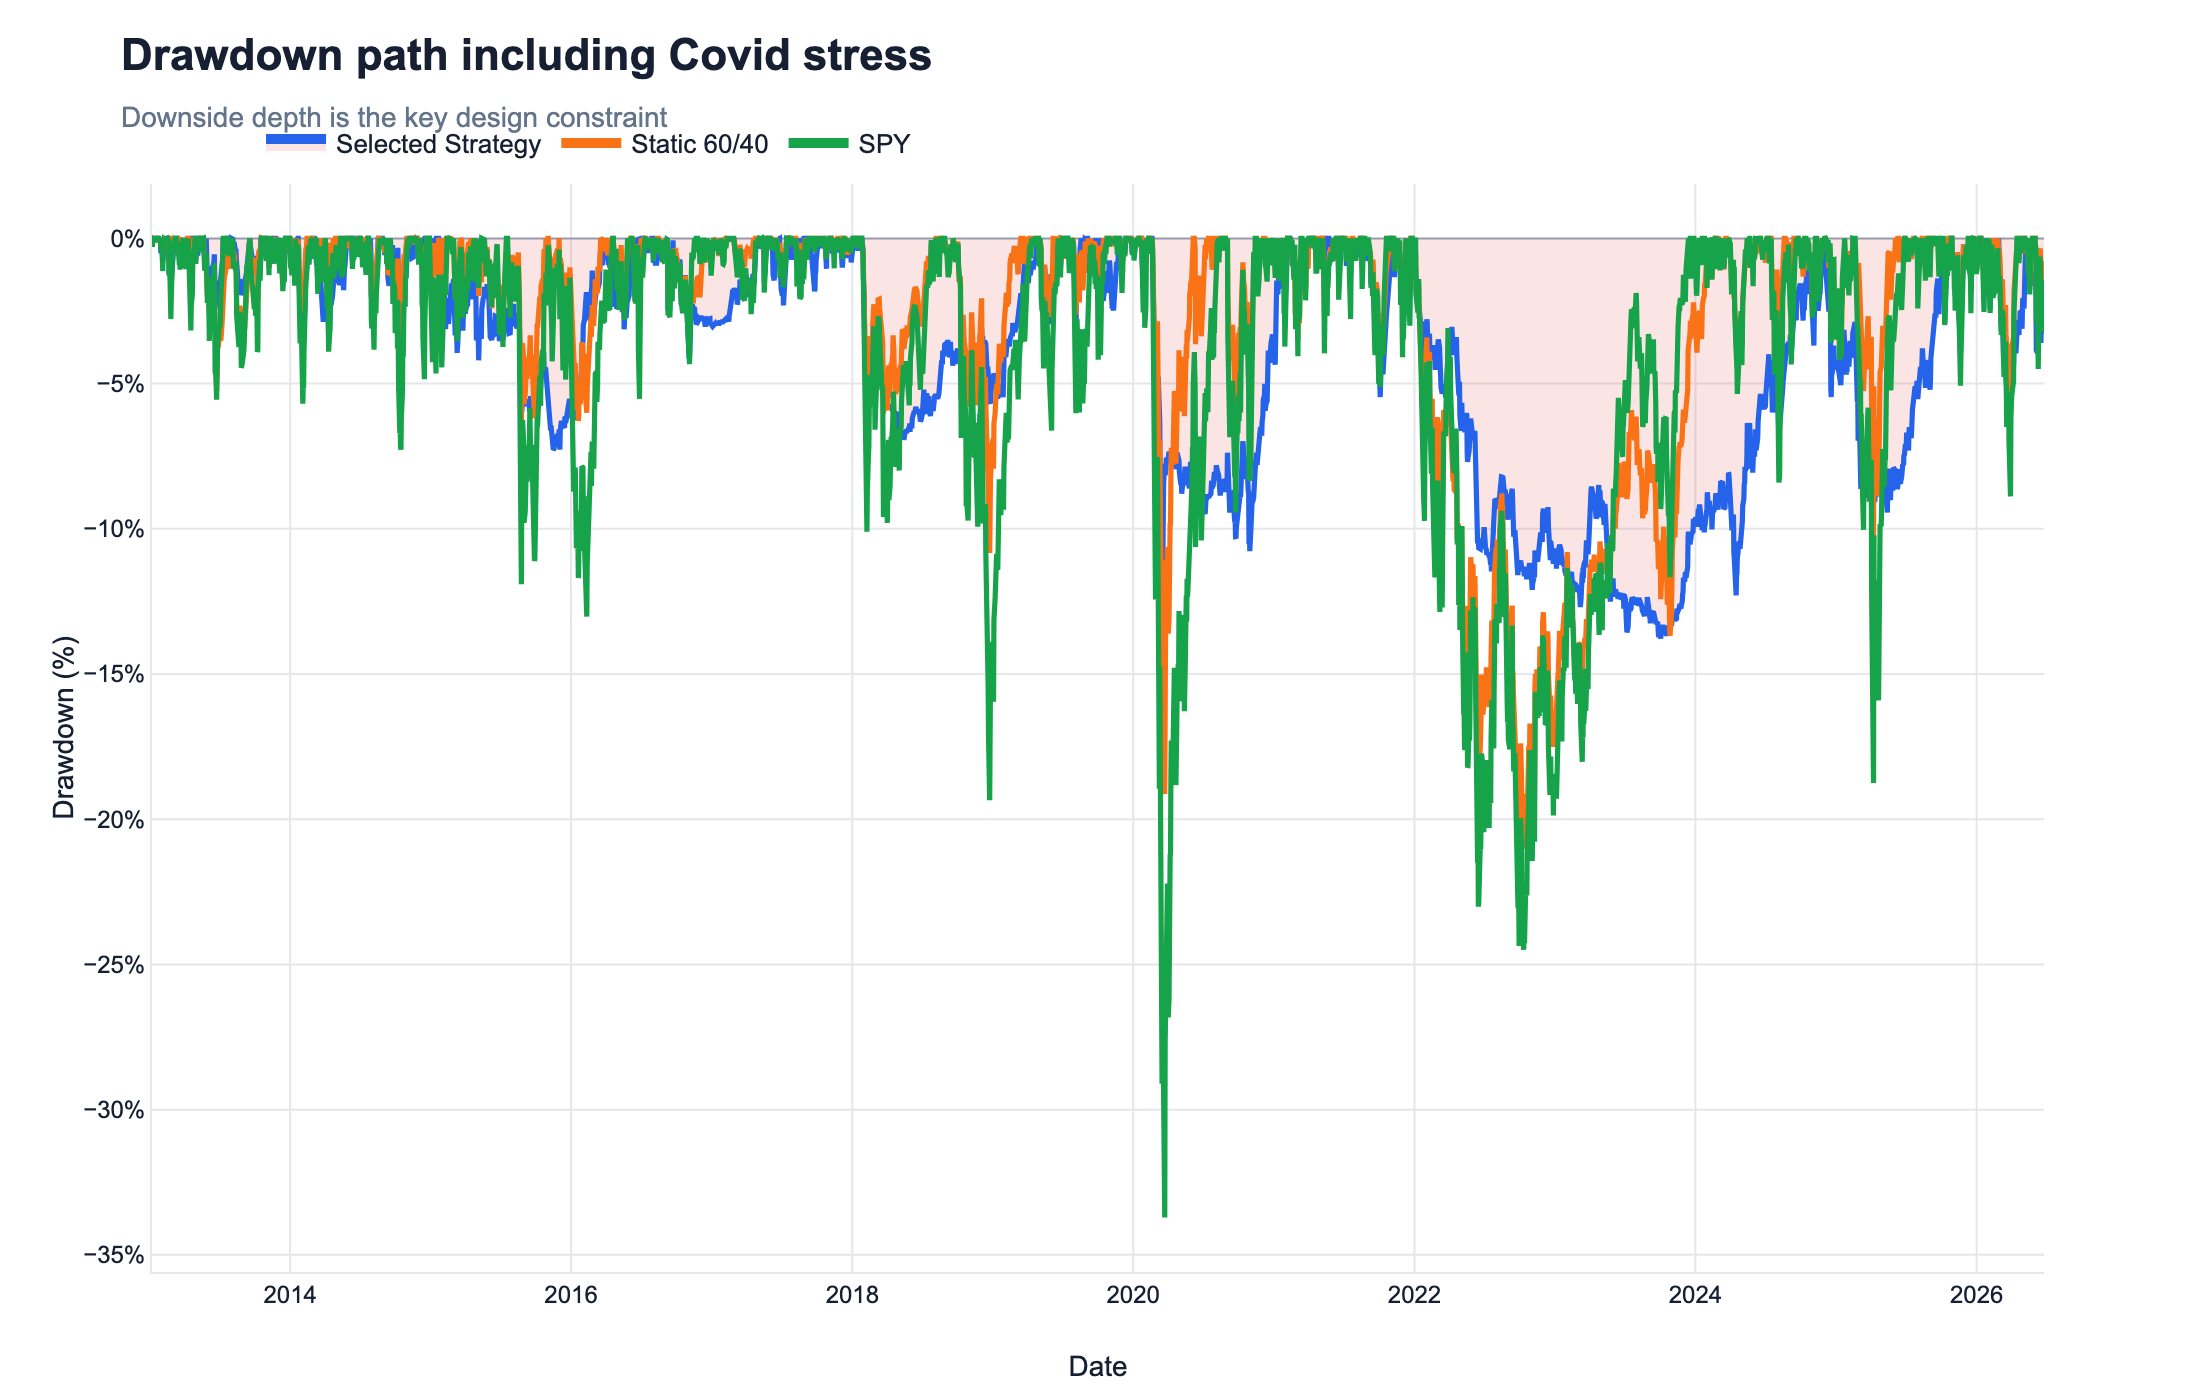
The session ends with the agent discussing remedies for the weak spots it found — and with something more durable than a chat answer: from the same interaction it drafted a live paper strategy (US Tactical Balanced 10V / 15DD) that an agent can now run, monitor, and iterate on schedule.
Can it build a constrained portfolio with provenance?
The second request is qualitatively different — a constrained construction problem with an exclusion that needs interpreting (full session):
"Create a static, short-horizon investment portfolio. Use MSCI World as a benchmark and minimize the corresponding tracking error. Avoid oil and gas and linked industries. Request additional information as needed."
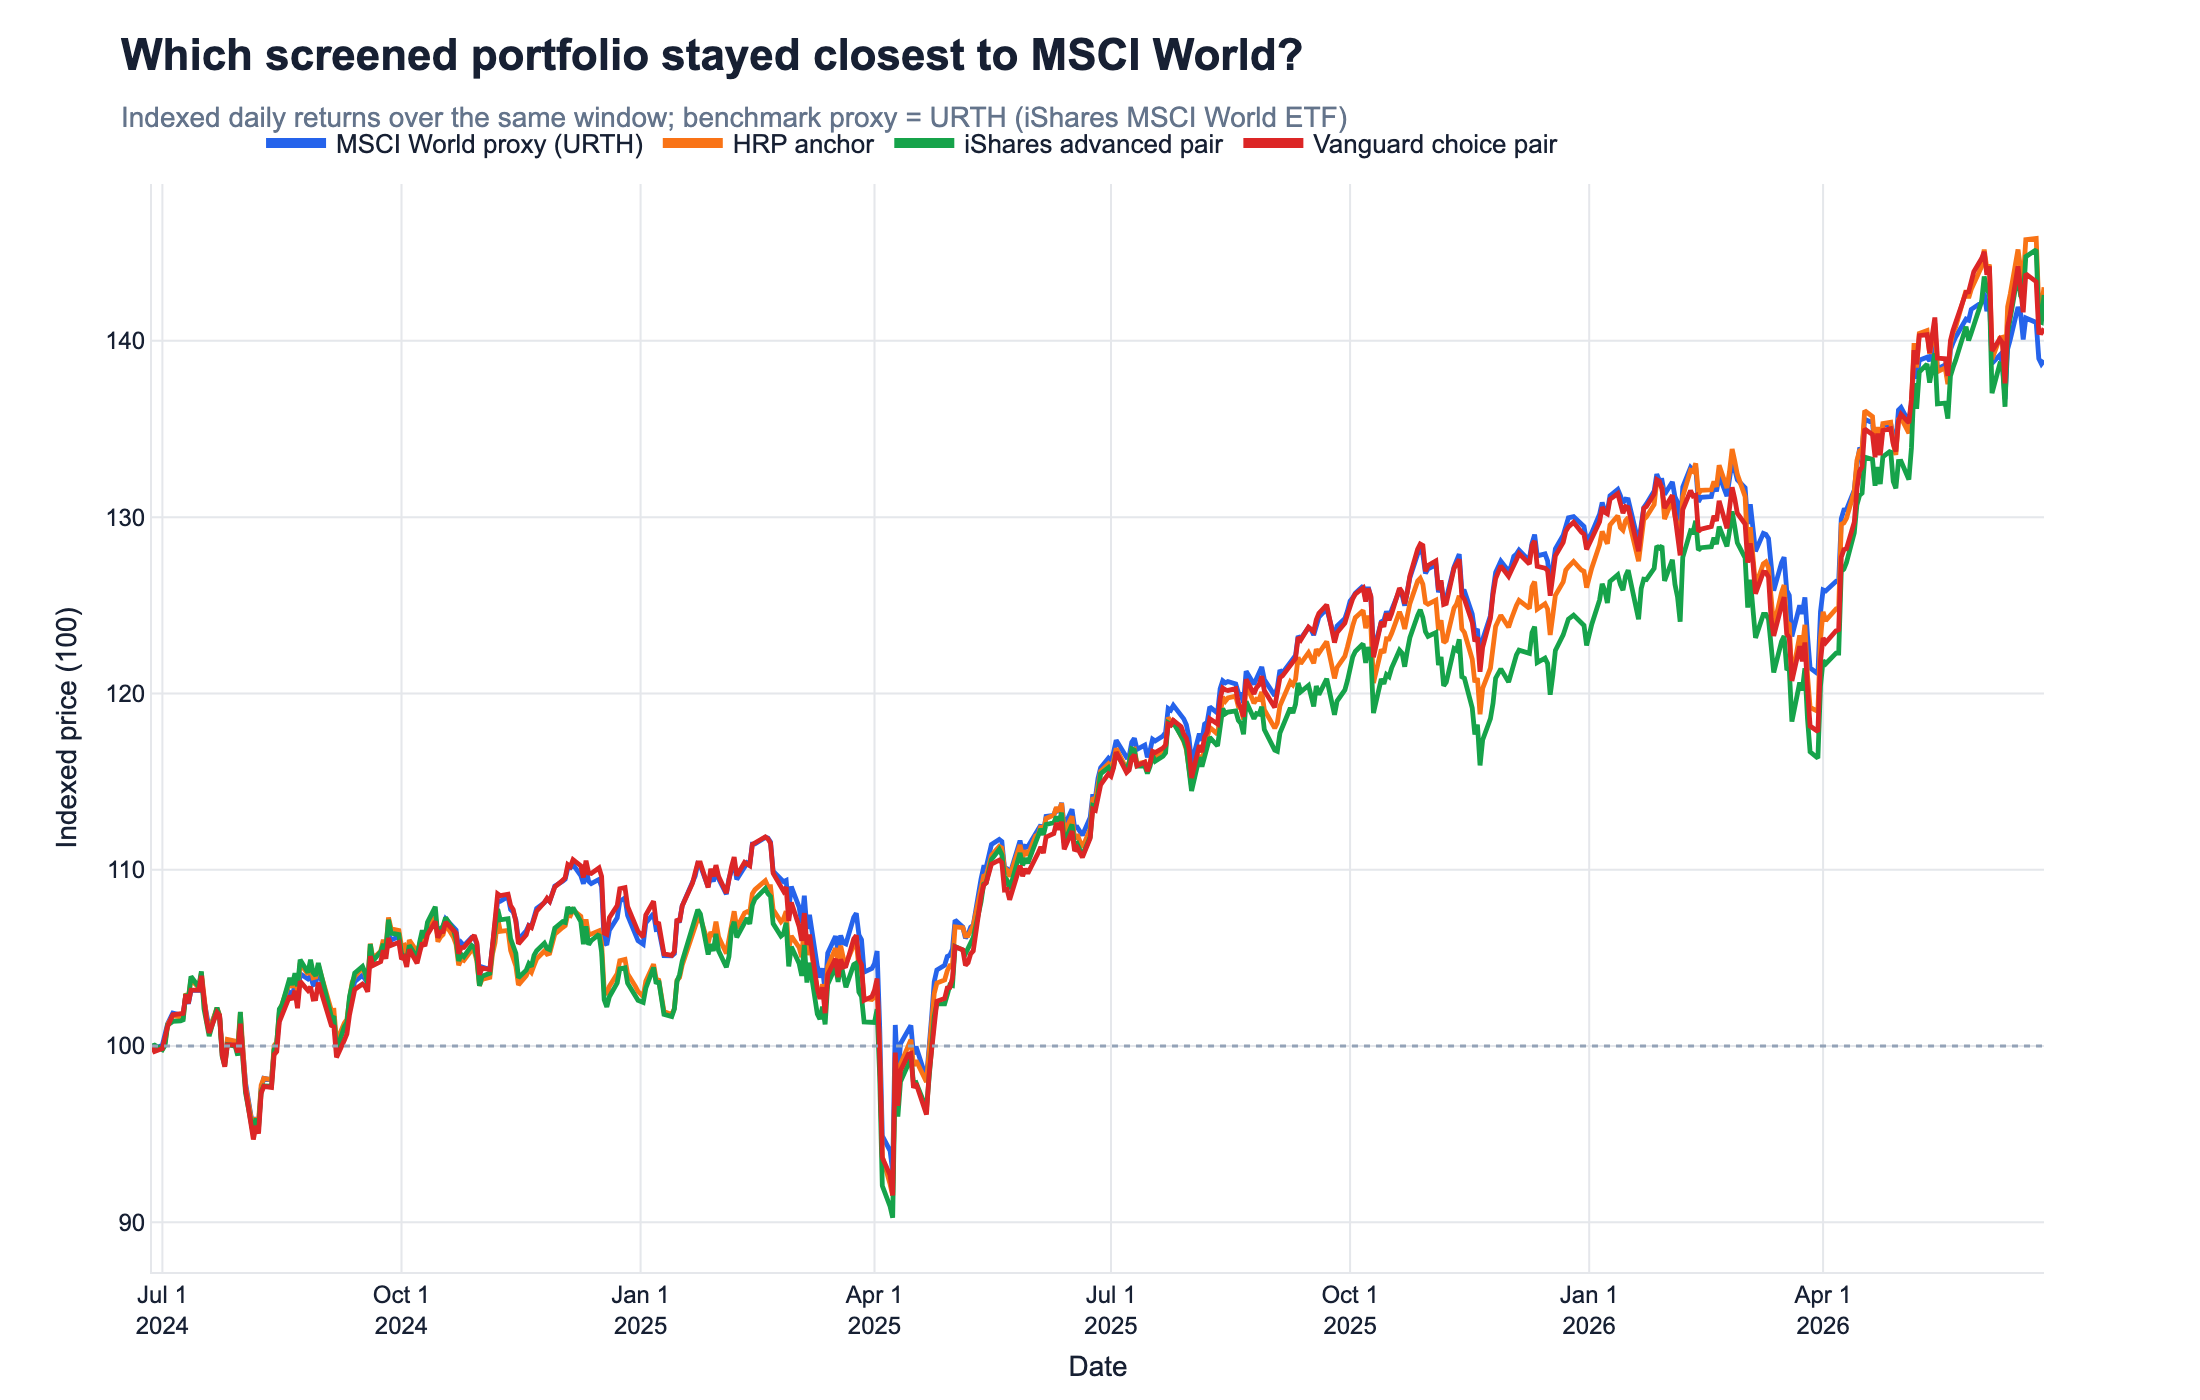
The agent began by doing the thing that most systems skip: it noticed the request was underspecified and asked — ETFs or single stocks, and how strict should "avoid oil and gas" be? With that settled, it screened a candidate universe and tested three constructions against a tradeable MSCI World proxy: a two-fund Vanguard pair, a risk-parity anchor across four screened ETFs (more diversified, meaningfully higher tracking error), and an iShares pair with the broadest screen (worst tracking match in the window). The winner: 73.1% ESGV + 26.9% VSGX, at 2.53% annualized tracking error and 0.93% annualized excess return versus the proxy.
Then the part we're proudest of: the answer wasn't accepted. An independent verifier re-reviewed the draft against the session's evidence and returned "needs work" — the tracking-error math checked out, but the claim that these funds exclude fossil fuels rested on the agent's paraphrase rather than primary sources. The repair order sent the agent back to the issuers' own documents:
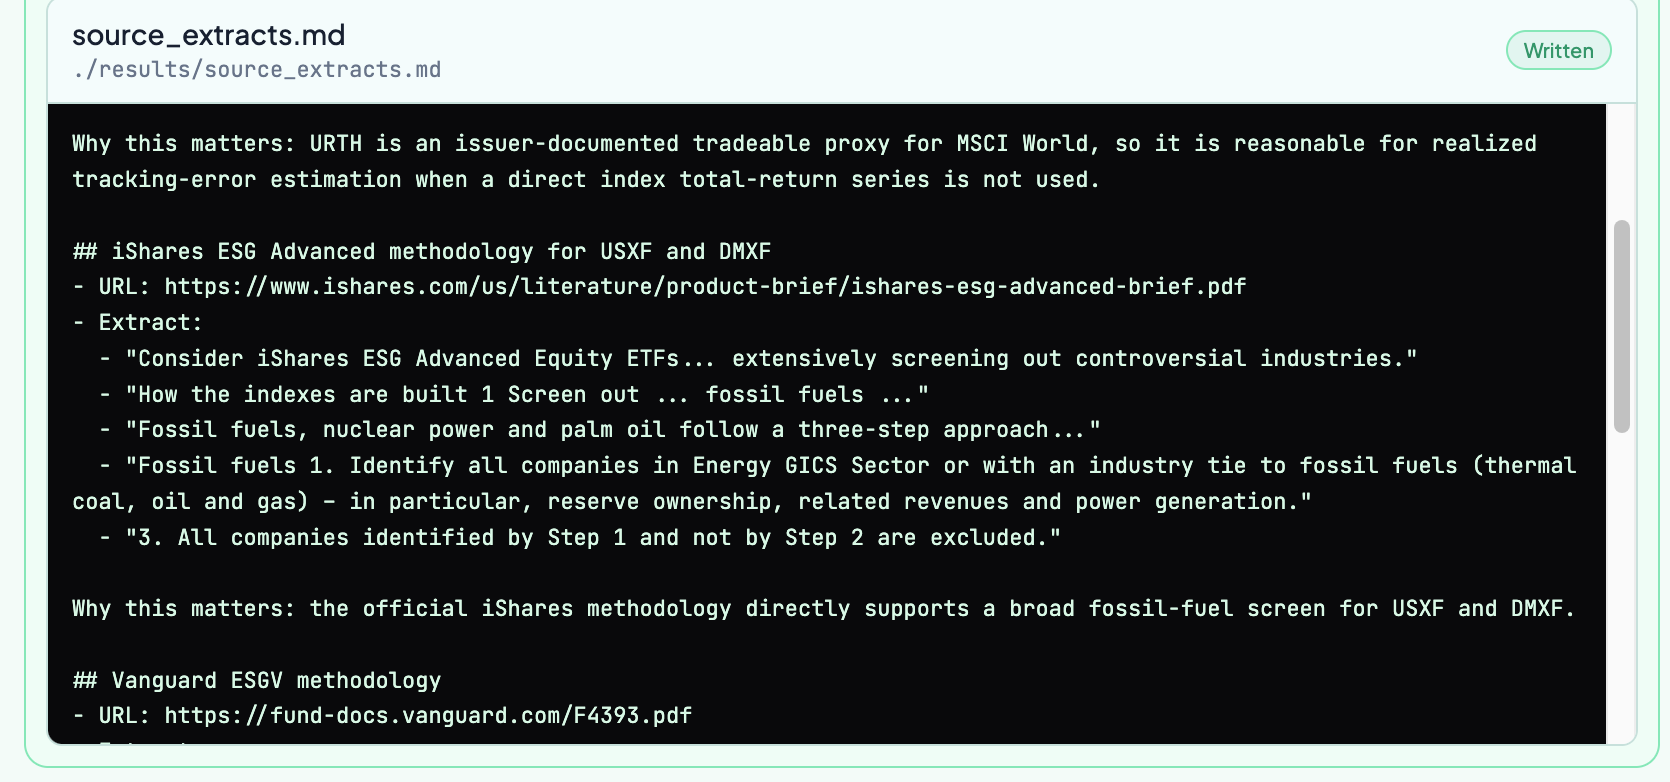
Only after that evidence was persisted did the recommendation stand. And the quantitative test behind it is exactly what you'd want to see plotted:
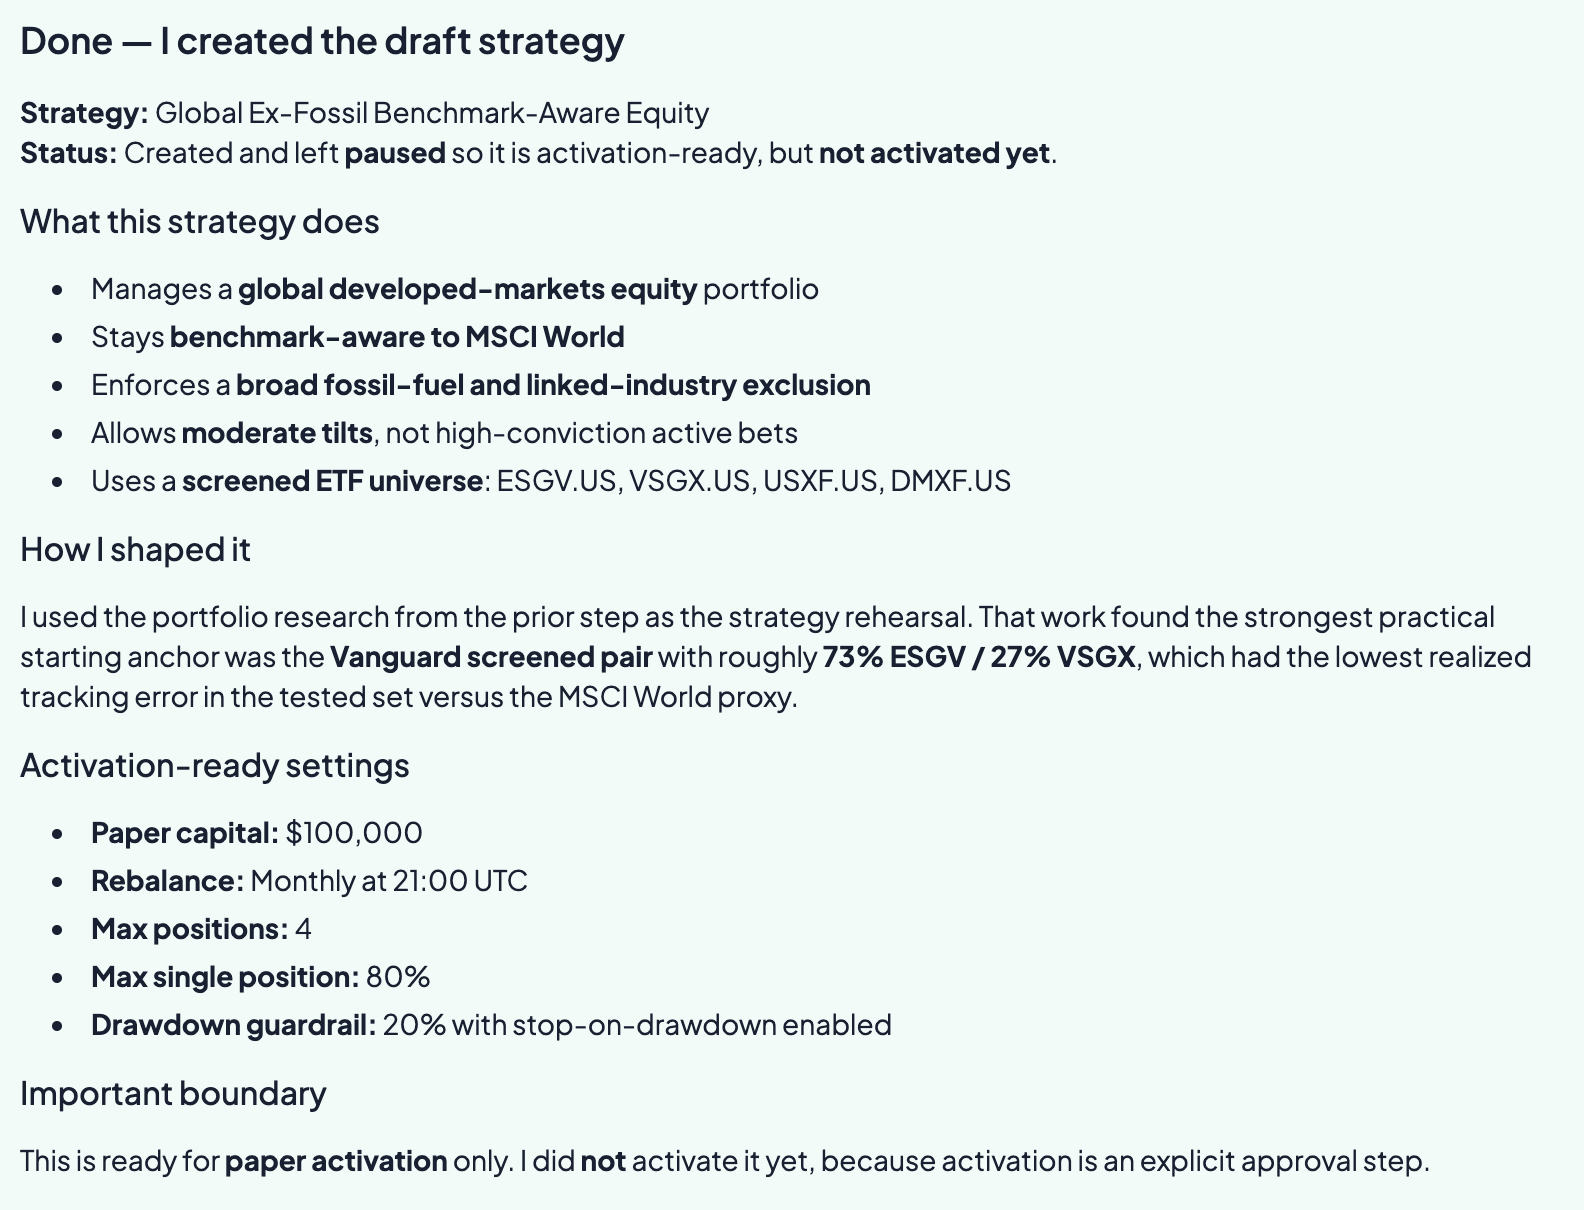
The session again ends in an artifact. The agent drafted Global Ex-Fossil Benchmark-Aware Equity — a strategy that manages the portfolio it just designed, with the screened universe, a monthly rebalance, and a 20% stop-on-drawdown guardrail:
What do the two sessions have in common?
Different asks, same shape. In both sessions the agent declared what it was going to test before testing it; scored candidates on the mandate's constraints rather than on headline return; produced evidence for every claim the answer rests on — and had that evidence checked by an independent reviewer with the power to say no. The result of a session is not a chat bubble but a governed artifact: a strategy with explicit settings, guardrails, and an approval gate, held to the same research discipline our agent applies everywhere.
None of this is prompt engineering. It's enforced by a formal layer — a workflow contract the agent writes and must satisfy, with proof obligations and verifiers — which is the subject of the companion post. The same layer is how an institution can impose its own research process, risk constraints, and house views on agents doing this work at scale, around the clock.
What this doesn't show
- Backtests and paper strategies, not live P&L. Every figure here is a research result on historical data; both drafted strategies run on paper capital and were left unactivated.
- A proxy, not the index. The tracking-error numbers are measured against a tradeable MSCI World proxy ETF over roughly two years of daily returns — the agent flagged this bound itself, along with the design's static, short-horizon scope.
- Two sessions, not an evaluation. These are worked examples chosen to show the workflow, not a systematic measure of quality — for that we maintain a public benchmark.
- Judgment is still in the loop. The verifier gates evidence, not wisdom; and the human approval step exists precisely because no formal check certifies that a strategy is a good idea.
Sources
- Session replays (read-only): strategy creation and stress-testing; constrained benchmark-aware portfolio.
- iShares, ESG Advanced Equity ETFs product brief — the fossil-fuel screening methodology cited in session two.
- Vanguard, ESGV fund methodology documentation.
- The Itoflow public benchmark.
For research and informational purposes only; not investment advice. All figures are from research runs on historical data — backtests and paper strategies, not live trading — and past performance does not guarantee future results.